Data Analysis and Visualization

COVID-19 Global Analysis

A deep analysis on global spread of coronavirus. This study includes daily count of cases, map plotting, spread rate, testing rate, mortality rate, age analysis for all countries represented using interactive visualization.

IPython Notebook Open in Google Colab

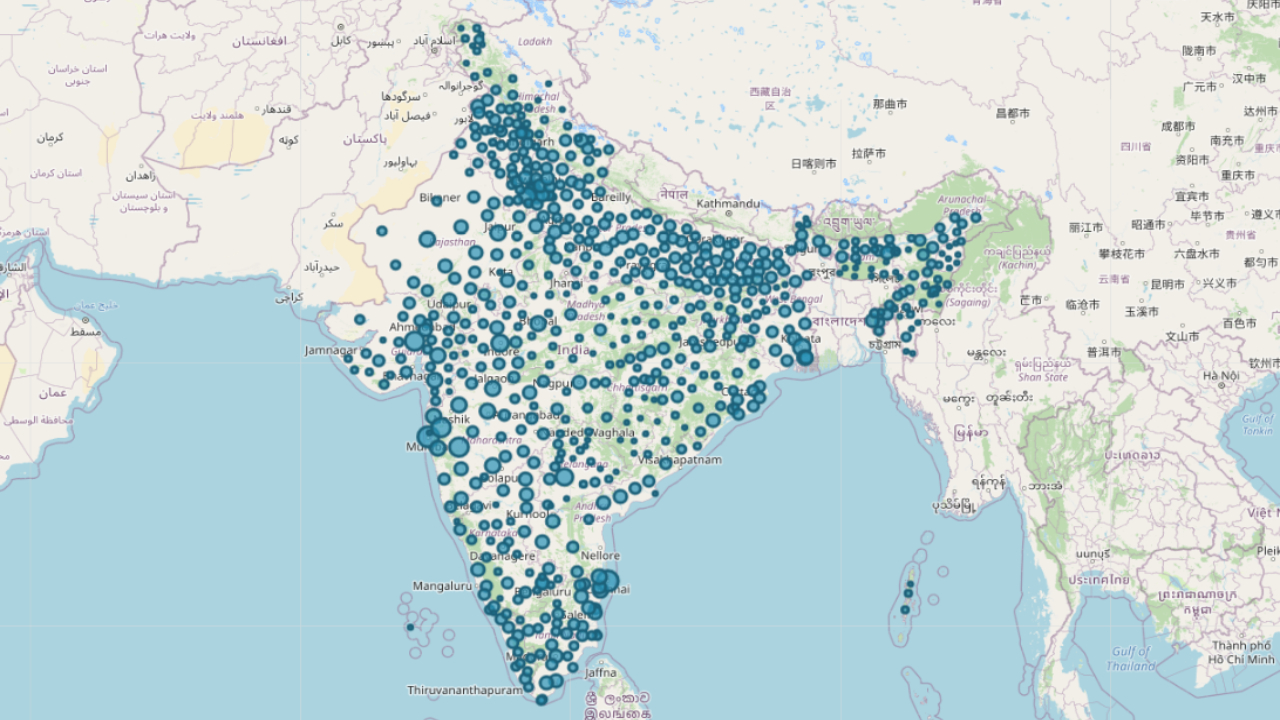
COVID-19 India Analysis

A graphical representaion and forcasting of spread of coronavirus in India. Comparing different states mortality and spread rate. It also includes age and sex analysis and the decisions took by the government to contain the virus.

IPython Notebook Open in Google Colab

Predictive Modelling

Bike Rental

A model to predict the number of bikes going on rent using previous two years data. Data includes features like season, weather condition, humidity, windspeed etc. An analysis on these factors is done to indicate the relation with the outcome.


Ipython Notebook Github Repository

Employee Absenteeism

This project targets the study of underlying factors that causes employees absenteeism. Factors like reason for absence, chronic diseases, money spend in commute, distance between office and home, number of children etc are used to predict the absenteeism behaviour of an employee.

Ipython Notebook Github Repository

Machine Learning

Zomato Reviews Analysis

A Dashboard demonstrating Sentimental and Emotional analysis of top rated restaurants reviews located in NCR.


Open App

Twitter Sentimental analysis

Sentimental analysis of tweets using twitter API and textblob in python. This webapp checks the polarity of every tweet seperately and shows the percentage of different opinions on a piechart.

Open App

Articles

plotly with nbconvert in google colab

A short walkthrough to convert IPython notebooks to HTML containing plotly visuallizations.

Open

Plotly animated choropleth

Tutorial on how to create animated world map changing colors with date. The data used is of the ongoing COVID-19 pandemic global data.

Open